
Topics
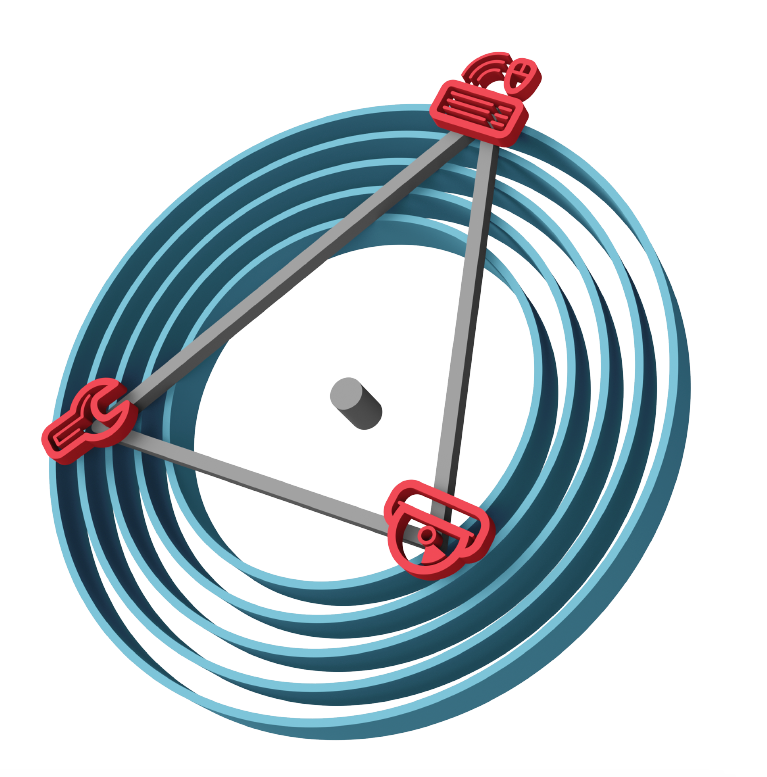
The Triangle of Illustration
2020-07-09
In this context, characteristic properties when creating a technical illustration are
- sustainability,
- amount of data and
- speed.

Speed, you could also say “clicks to target”, i.e. how much time is needed to create the graphic, is a very obvious and easy to understand property. However, if you save too much time here, you will have to invest more time again at the latest when changes occur.

Sustainability means how durable the structures created and functions applied are. Some “quick and dirty” created graphics literally fall on the feet of the creator, if changes or derivations of a graphic have to be made. Unfortunately, if the work is done properly, the speed suffers at first.

Data volume, i.e. the file size of the published illustration. If the amount of data appears to be large relative to the content, sustainability is not far off. Subsequent problems are not long in coming, such as oversized PDF files in which graphics are built up in slow motion.